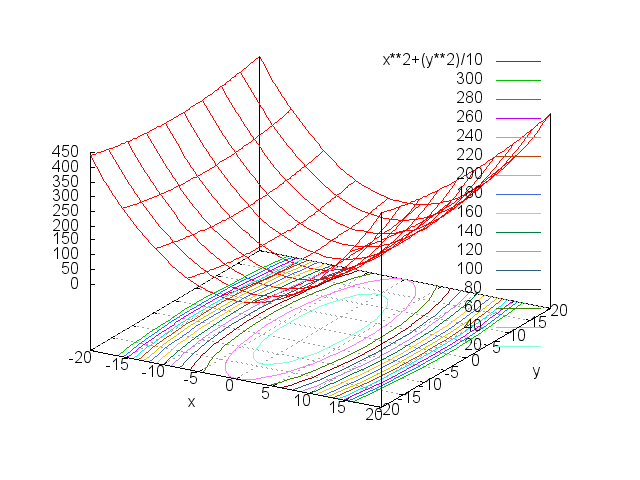
Level 3.1 : y = x2+(y2)/10
# 作図方法
gnuplot<<EOF
clear
set xrange [-20:20]
set yrange [-20:20]
splot x**2+(y**2)/10
set grid
set contour
set cntrparam levels incremental 0,20,300
set xlabel "x"
set ylabel "y"
set terminal png
set output "func3_1.png"
replot
set terminal svg
set output "func3_1.svg"
replot
set terminal pdf
set output "func3_1.pdf"
replot