Level 4 : Houzing Data Set
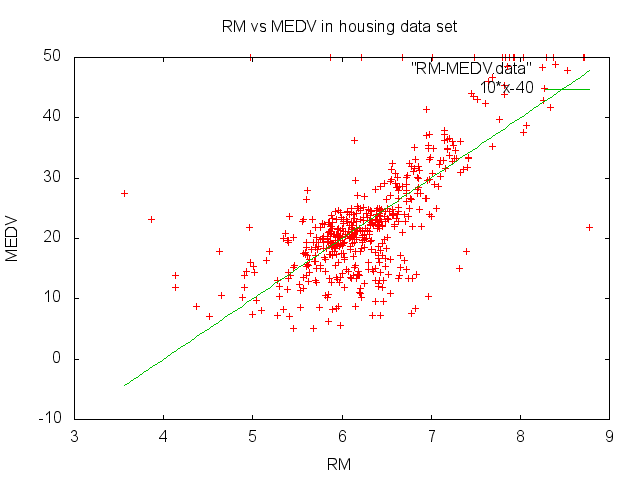
# 作図方法
# 予めRM-MEDV.dataをダウンロードしておくこと。
gnuplot<<EOF
clear
plot "RM-MEDV.data", 10*x-40 w l
set xlabel "RM"
set ylabel "MEDV"
set title "RM vs MEDV in housing data set"
set terminal png
set output "func4.png"
replot
EOF
# 作図方法 # 予めRM-MEDV.dataをダウンロードしておくこと。 gnuplot<<EOF clear plot "RM-MEDV.data", 10*x-40 w l set xlabel "RM" set ylabel "MEDV" set title "RM vs MEDV in housing data set" set terminal png set output "func4.png" replot EOF