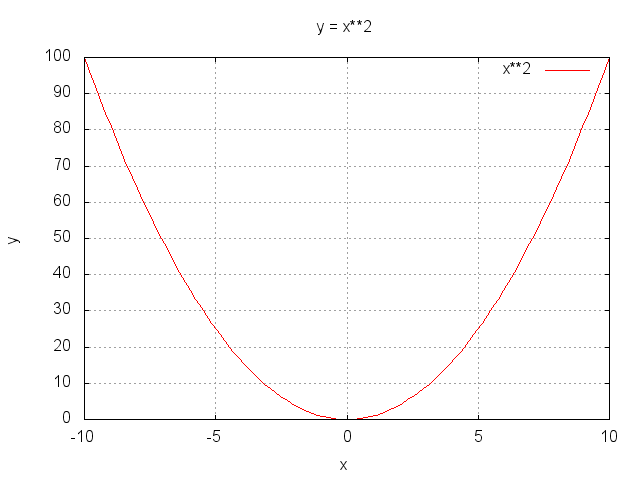
Level 2.1 : y = x2
# 作図方法
gnuplot<<EOF
clear
plot x
set grid
set xlabel "x"
set ylabel "y"
set title "y = x**2"
set terminal png
set output "func2_1.png"
replot
set terminal svg
set output "func2_1.svg"
replot
set terminal pdf
set output "func2_1.pdf"
replot
EOF