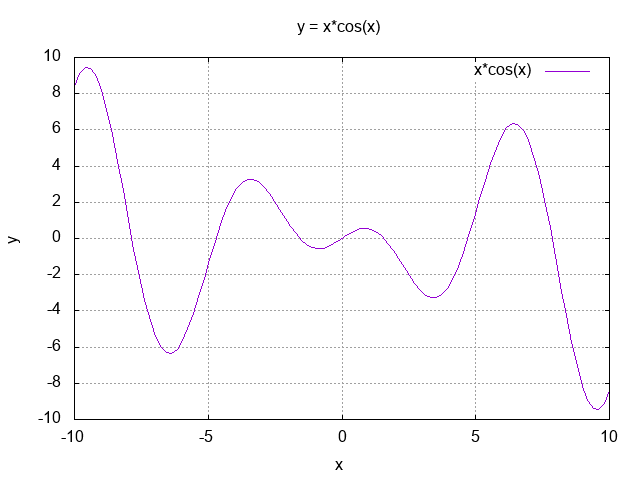
Level 2.3 : y = x*cos(x)
# 作図方法
gnuplot<<EOF
clear
plot x*cos(x)
set grid
set xlabel "x"
set ylabel "y"
set title "y = x*cos(x)"
set terminal png
set output "func2_3.png"
replot
set terminal pdf
set output "func2_3.pdf"
replot
EOF
# 作図方法 gnuplot<<EOF clear plot x*cos(x) set grid set xlabel "x" set ylabel "y" set title "y = x*cos(x)" set terminal png set output "func2_3.png" replot set terminal pdf set output "func2_3.pdf" replot EOF