35. グラフマイニングの例#
データセット
social circles: Facebookから facebook_combined.txt.zip を利用。
graph1.txt, graph2.txt, graph_modularity_simple.txt: 小さなグラフ例
ツール等
Graphviz: ノードとエッジで構成されるグラフ描画ツール。
pygraphviz: GraphvizをPythonから使うためのラッパー。
networkx: ネットワーク解析パッケージ。
35.1. 環境構築#
!apt install libgraphviz-dev
!pip install pygraphviz
Reading package lists... Done
Building dependency tree
Reading state information... Done
The following additional packages will be installed:
  libgail-common libgail18 libgtk2.0-0 libgtk2.0-bin libgtk2.0-common
  libgvc6-plugins-gtk libxdot4
Suggested packages:
  gvfs
The following NEW packages will be installed:
  libgail-common libgail18 libgraphviz-dev libgtk2.0-0 libgtk2.0-bin
  libgtk2.0-common libgvc6-plugins-gtk libxdot4
0 upgraded, 8 newly installed, 0 to remove and 39 not upgraded.
Need to get 2,120 kB of archives.
After this operation, 7,128 kB of additional disk space will be used.
Get:1 http://archive.ubuntu.com/ubuntu bionic/main amd64 libgtk2.0-common all 2.24.32-1ubuntu1 [125 kB]
Get:2 http://archive.ubuntu.com/ubuntu bionic/main amd64 libgtk2.0-0 amd64 2.24.32-1ubuntu1 [1,769 kB]
Get:3 http://archive.ubuntu.com/ubuntu bionic/main amd64 libgail18 amd64 2.24.32-1ubuntu1 [14.2 kB]
Get:4 http://archive.ubuntu.com/ubuntu bionic/main amd64 libgail-common amd64 2.24.32-1ubuntu1 [112 kB]
Get:5 http://archive.ubuntu.com/ubuntu bionic/universe amd64 libxdot4 amd64 2.40.1-2 [15.7 kB]
Get:6 http://archive.ubuntu.com/ubuntu bionic/universe amd64 libgvc6-plugins-gtk amd64 2.40.1-2 [18.2 kB]
Get:7 http://archive.ubuntu.com/ubuntu bionic/universe amd64 libgraphviz-dev amd64 2.40.1-2 [57.3 kB]
Get:8 http://archive.ubuntu.com/ubuntu bionic/main amd64 libgtk2.0-bin amd64 2.24.32-1ubuntu1 [7,536 B]
Fetched 2,120 kB in 1s (1,456 kB/s)
Selecting previously unselected package libgtk2.0-common.
(Reading database ... 160772 files and directories currently installed.)
Preparing to unpack .../0-libgtk2.0-common_2.24.32-1ubuntu1_all.deb ...
Unpacking libgtk2.0-common (2.24.32-1ubuntu1) ...
Selecting previously unselected package libgtk2.0-0:amd64.
Preparing to unpack .../1-libgtk2.0-0_2.24.32-1ubuntu1_amd64.deb ...
Unpacking libgtk2.0-0:amd64 (2.24.32-1ubuntu1) ...
Selecting previously unselected package libgail18:amd64.
Preparing to unpack .../2-libgail18_2.24.32-1ubuntu1_amd64.deb ...
Unpacking libgail18:amd64 (2.24.32-1ubuntu1) ...
Selecting previously unselected package libgail-common:amd64.
Preparing to unpack .../3-libgail-common_2.24.32-1ubuntu1_amd64.deb ...
Unpacking libgail-common:amd64 (2.24.32-1ubuntu1) ...
Selecting previously unselected package libxdot4.
Preparing to unpack .../4-libxdot4_2.40.1-2_amd64.deb ...
Unpacking libxdot4 (2.40.1-2) ...
Selecting previously unselected package libgvc6-plugins-gtk.
Preparing to unpack .../5-libgvc6-plugins-gtk_2.40.1-2_amd64.deb ...
Unpacking libgvc6-plugins-gtk (2.40.1-2) ...
Selecting previously unselected package libgraphviz-dev.
Preparing to unpack .../6-libgraphviz-dev_2.40.1-2_amd64.deb ...
Unpacking libgraphviz-dev (2.40.1-2) ...
Selecting previously unselected package libgtk2.0-bin.
Preparing to unpack .../7-libgtk2.0-bin_2.24.32-1ubuntu1_amd64.deb ...
Unpacking libgtk2.0-bin (2.24.32-1ubuntu1) ...
Setting up libgtk2.0-common (2.24.32-1ubuntu1) ...
Setting up libxdot4 (2.40.1-2) ...
Setting up libgtk2.0-0:amd64 (2.24.32-1ubuntu1) ...
Setting up libgail18:amd64 (2.24.32-1ubuntu1) ...
Setting up libgail-common:amd64 (2.24.32-1ubuntu1) ...
Setting up libgvc6-plugins-gtk (2.40.1-2) ...
Setting up libgraphviz-dev (2.40.1-2) ...
Setting up libgtk2.0-bin (2.24.32-1ubuntu1) ...
Processing triggers for man-db (2.8.3-2ubuntu0.1) ...
Processing triggers for libc-bin (2.27-3ubuntu1.2) ...
/sbin/ldconfig.real: /usr/local/lib/python3.7/dist-packages/ideep4py/lib/libmkldnn.so.0 is not a symbolic link

Collecting pygraphviz
?25l  Downloading https://files.pythonhosted.org/packages/3a/d6/2c56f09ee83dbebb62c40487e4c972135661b9984fec9b30b77fb497090c/pygraphviz-1.7.zip (118kB)
     |████████████████████████████████| 122kB 7.9MB/s
?25hBuilding wheels for collected packages: pygraphviz
  Building wheel for pygraphviz (setup.py) ... ?25l?25hdone
  Created wheel for pygraphviz: filename=pygraphviz-1.7-cp37-cp37m-linux_x86_64.whl size=166142 sha256=6bbbb96a20c7c22804e6b3f842eb5a71b5a652364c064af09c58727fae084d8b
  Stored in directory: /root/.cache/pip/wheels/32/59/00/14934a4292c4359eeabcdbf90f33d309b55d0f1be8a1262523
Successfully built pygraphviz
Installing collected packages: pygraphviz
Successfully installed pygraphviz-1.7
import pandas as pd
import networkx as nx
import pygraphviz
import matplotlib.pyplot as plt
35.2. やや大きめの実データを用いたグラフ化例#
facebook_combined.txt には「どのノード間にエッジがあるか」というリンク情報が保存されている。例えば「0 1」という行なら「ノード0とノード1の間にエッジがある」ことを意味している。
このままではグラフではないため、データを一度DataFrameとして読み込み、それを from_edges_to_networks() によりグラフに変換する。
35.2.1. データ準備(facebook_combined.txt)#
!curl -O http://snap.stanford.edu/data/facebook_combined.txt.gz
!gzip -d facebook_combined.txt.gz
  % Total    % Received % Xferd  Average Speed   Time    Time     Time  Current
                                 Dload  Upload   Total   Spent    Left  Speed
100  213k  100  213k    0     0   808k      0 --:--:-- --:--:-- --:--:--  808k
!head facebook_combined.txt
0 1
0 2
0 3
0 4
0 5
0 6
0 7
0 8
0 9
0 10
filename = "facebook_combined.txt"
df = pd.read_csv(filename, sep=' ')
df[:5]
| 0 | 1 | |
|---|---|---|
| 0 | 0 | 2 |
| 1 | 0 | 3 |
| 2 | 0 | 4 |
| 3 | 0 | 5 |
| 4 | 0 | 6 |
# エッジ数の確認(上位10件)

counts = df['0'].value_counts()
counts[:10]
107     1043
1684     778
1912     748
3437     542
0        346
348      225
1941     215
1985     207
483      191
1917     189
Name: 0, dtype: int64
35.2.2. エッジ集合のDataFrameからグラフに変換#
# グラフ変換

def from_edges_to_networks(filename):
    """グラフ読み込み
    Graphvizのラッパーであるpygraphvizにデータを渡すため、
    netoworkx.Graph()へノードとエッジ集合を読み込む。
    """
    G = nx.Graph()
    with open(filename) as fh:
        for line in fh:
            edges = list(map(int, line.split(" ")))
            G.add_edge(edges[0], edges[1])
    return G


G = nx.read_edgelist(filename, nodetype=int)

# ノード数、エッジ数の確認
print(nx.number_of_nodes(G), nx.number_of_edges(G))
4039 88234
35.2.3. グラフ描画#
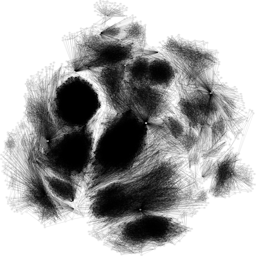
直接描画することが困難なサイズなので、一度ファイルに保存し、それを縮小したものを描画している。
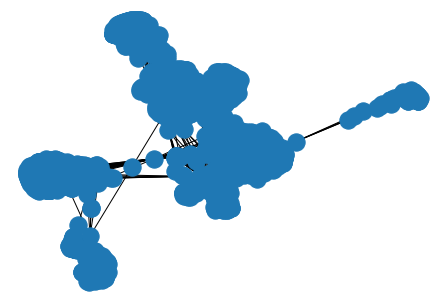
# そのまま描画すると潰れてしまう、、
nx.draw(G)
# save graph

pos = nx.nx_agraph.pygraphviz_layout(G, prog='sfdp', args='-Goverlap=false -Tpng -o facebook.png')


from PIL import Image
from IPython.display import display

img = Image.open("facebook.png")
img_resize = img.resize((256,256)) # 画像リサイズ
img_resize.save("facebook_s.png")

with Image.open("facebook_s.png") as im:
  display(im)
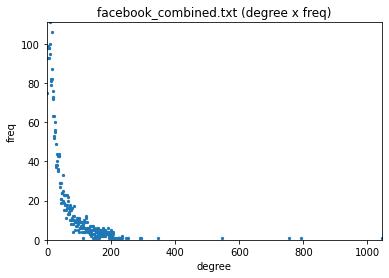
35.2.4. ネットワーク分析例#
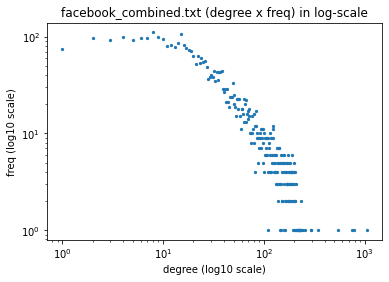
エッジ数をカウントし、エッジ数あたりの出現回数を描画。
上記をlog-scaleで描画。
# degree distribution
# normal scale

import collections

# ノード毎に有するエッジ数をカウント
count = []
for index_of_node in G.adj:
    count.append(len(G.adj[index_of_node]))

count.sort()
temp = collections.Counter(count)

# エッジ数あたりの出現回数をカウント
degree, freq = zip(*temp.items())

plt.scatter(degree, freq, s=5)
plt.xlim(0, max(degree))
plt.ylim(0, max(freq))
plt.xlabel('degree')
plt.ylabel('freq')
plt.title(filename + ' (degree x freq)')
plt.show()
# log scale
plt.scatter(degree, freq, s=5)
plt.xscale('log')
plt.yscale('log')
plt.xlabel('degree (log10 scale)')
plt.ylabel('freq (log10 scale)')
plt.title(filename + ' (degree x freq) in log-scale')
plt.show()
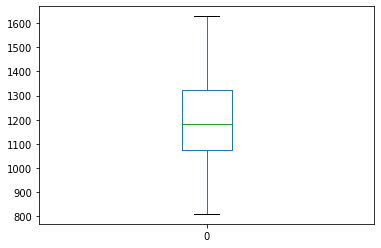
35.2.5. Zipfの法則っぽさを確認#
zipf_values = []
for i in range(10,50):
  value = i * freq[i]
  zipf_values.append(value)

zipf_values
[810,
 902,
 948,
 1131,
 1484,
 1230,
 1216,
 1241,
 1296,
 1197,
 1040,
 1323,
 1166,
 1380,
 1320,
 1400,
 1274,
 999,
 1064,
 1160,
 1140,
 1364,
 1120,
 1419,
 1224,
 1505,
 1548,
 1628,
 1102,
 1053,
 1160,
 861,
 1218,
 903,
 836,
 1080,
 1104,
 1128,
 1584,
 1225]
df = pd.DataFrame(zipf_values)
df.plot(kind='box')
<matplotlib.axes._subplots.AxesSubplot at 0x7f1ea0316f10>
35.3. ページランクの例#
35.3.1. データセットの用意#
!curl -O https://raw.githubusercontent.com/naltoma/datamining_intro/master/4-casestudy/graph/graph1.txt
!curl -O https://raw.githubusercontent.com/naltoma/datamining_intro/master/4-casestudy/graph/graph2.txt
!ls
  % Total    % Received % Xferd  Average Speed   Time    Time     Time  Current
                                 Dload  Upload   Total   Spent    Left  Speed
100    20  100    20    0     0    124      0 --:--:-- --:--:-- --:--:--   124
  % Total    % Received % Xferd  Average Speed   Time    Time     Time  Current
                                 Dload  Upload   Total   Spent    Left  Speed
100   122  100   122    0     0    734      0 --:--:-- --:--:-- --:--:--   734
facebook_combined.txt  facebook_s.png  graph2.txt
facebook.png	       graph1.txt      sample_data
!cat graph1.txt
A B
A C
B C
C A
D C
35.3.2. ランダムサーファーモデルによるシミュレーション#
import random

def random_surfer(G, max_itr=1000, d=0.15):
    """ランダムサーファーモデルのシミュレーション。
    ランダムなノードから出発し、そのページのout-edgesをランダムに選択して移動する。
    ただし、確率dでページ遷移を辞め、無作為にノードを選んで再出発する。

    :param G: networkx.classes.digraph.DiGraph。有向グラフ。
    :param max_itr: ページ遷移回数。
    :param d: エッジ選択から離脱する確率。
    :return: 各ノードの訪問割合。
    """
    num = len(nx.nodes(G))
    nodes = list(nx.nodes(G))
    reached = {}
    count = 0
    current = random.choice(nodes)
    while True:
        if current in reached:
            reached[current] += 1
        else:
            reached.update({current:1})
        count += 1
        if count == max_itr:
            break
        if d < random.random():
            targets = [target for cur, target in nx.edges(G, current)]
            if len(targets) == 0:
                break
            current = random.choice(targets)
        else:
            current = random.choice(nodes)
            continue
        print(count,reached)

    for node in reached.keys():
        reached[node] /= count
    return reached


filename = "graph1.txt"
G = nx.read_edgelist(filename, create_using=nx.DiGraph())
reached = random_surfer(G, 20)
print(reached)
2 {'A': 1, 'D': 1}
3 {'A': 1, 'D': 1, 'C': 1}
4 {'A': 2, 'D': 1, 'C': 1}
5 {'A': 2, 'D': 1, 'C': 1, 'B': 1}
6 {'A': 2, 'D': 1, 'C': 2, 'B': 1}
7 {'A': 3, 'D': 1, 'C': 2, 'B': 1}
8 {'A': 3, 'D': 1, 'C': 2, 'B': 2}
9 {'A': 3, 'D': 1, 'C': 3, 'B': 2}
10 {'A': 4, 'D': 1, 'C': 3, 'B': 2}
11 {'A': 4, 'D': 1, 'C': 4, 'B': 2}
12 {'A': 5, 'D': 1, 'C': 4, 'B': 2}
13 {'A': 5, 'D': 1, 'C': 5, 'B': 2}
15 {'A': 7, 'D': 1, 'C': 5, 'B': 2}
16 {'A': 7, 'D': 1, 'C': 6, 'B': 2}
17 {'A': 8, 'D': 1, 'C': 6, 'B': 2}
18 {'A': 8, 'D': 1, 'C': 7, 'B': 2}
19 {'A': 9, 'D': 1, 'C': 7, 'B': 2}
{'A': 0.45, 'D': 0.05, 'C': 0.35, 'B': 0.15}
35.3.3. networkx.pagerankによるランク評価#
filename = "graph1.txt"
G = nx.read_edgelist(filename, create_using=nx.DiGraph())

# ランク算出
pr = nx.pagerank(G)
print(pr)
{'A': 0.372526246091333, 'B': 0.19582365458881654, 'C': 0.39415009931985023, 'D': 0.037500000000000006}
35.3.4. グラフ描画#
# グラフ描画
pos = nx.spring_layout(G)
labels = {}
for node in pr.keys():
    labels[node] = 'Node {}\n{}'.format(node, round(pr[node], 3))

G = nx.relabel_nodes(G, labels)

import graphviz
graphviz.Source(nx.nx_agraph.to_agraph(G))

35.4. 少し複雑なグラフでページランク確認#
filename = "graph2.txt"
G = nx.read_edgelist(filename, create_using=nx.DiGraph())

# ランク算出
pr = nx.pagerank(G)
print(pr)

# グラフ描画
pos = nx.spring_layout(G)
labels = {}
for node in pr.keys():
    labels[node] = 'Node {}\n{}'.format(node, round(pr[node], 3))

G = nx.relabel_nodes(G, labels)

#nx.nx_agraph.view_pygraphviz(G, prog='sfdp')

import graphviz
graphviz.Source(nx.nx_agraph.to_agraph(G))
#nx.draw_networkx(G)
{'1': 0.12174896105921995, '2': 0.04386978407256124, '3': 0.04386978407256124, '4': 0.04386978407256124, '5': 0.06530818443477784, '6': 0.10217580762337017, '7': 0.07144359556771177, '8': 0.05279920075611914, '15': 0.14450495559625123, '9': 0.03181526582418545, '10': 0.05885906219895707, '11': 0.02188284889175391, '12': 0.02188284889175391, '13': 0.02188284889175391, '14': 0.02188284889175391, '16': 0.13220421915470792}

35.5. モジュラリティの確認#
35.6. データセットの用意#
!curl -O https://raw.githubusercontent.com/naltoma/datamining_intro/master/4-casestudy/graph/graph_modularity_simple.txt
!head graph_modularity_simple.txt
  % Total    % Received % Xferd  Average Speed   Time    Time     Time  Current
                                 Dload  Upload   Total   Spent    Left  Speed

  0     0    0     0    0     0      0      0 --:--:-- --:--:-- --:--:--     0
100    84  100    84    0     0    518      0 --:--:-- --:--:-- --:--:--   521
1 2
1 3
1 4
1 5
2 3
2 4
2 5
3 4
3 5
4 5
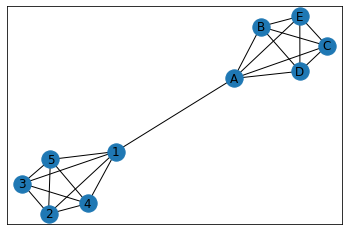
35.6.1. girvan_newman方式のモジュラリティ評価#
%matplotlib inline
from networkx.algorithms.community.centrality import girvan_newman

filename = "graph_modularity_simple.txt"
G = nx.read_edgelist(filename)

comp = girvan_newman(G)
print(tuple(sorted(c) for c in next(comp)))

#nx.nx_agraph.view_pygraphviz(G, prog='sfdp')
nx.draw_networkx(G)
(['1', '2', '3', '4', '5'], ['A', 'B', 'C', 'D', 'E'])
from networkx import community

clusters = []
clusters.append([{'1', '2', '3', '4', '5'}, {'A', 'B', 'C', 'D', 'E'}])
clusters.append([{'2', '3', '4', '5'}, {'1', 'A', 'B', 'C', 'D', 'E'}])
clusters.append([{'3', '4', '5'}, {'2', '1', 'A', 'B', 'C', 'D', 'E'}])
clusters.append([{'4', '5'}, {'2', '3', '1', 'A', 'B', 'C', 'D', 'E'}])
clusters.append([{'5'}, {'2', '3', '4', '1', 'A', 'B', 'C', 'D', 'E'}])

for i, cluster in enumerate(clusters):
    modularity = community.modularity(G, cluster)
    print('modularity(cluster{}) = {}'.format(i, modularity))
modularity(cluster0) = 0.45238095238095233
modularity(cluster1) = 0.2811791383219955
modularity(cluster2) = 0.12244897959183668
modularity(cluster3) = 0.02267573696145122
modularity(cluster4) = -0.018140589569161043